CDN Log Analysis: Understanding Traffic, Performance, and Security from Access Logs
Last year, a client noticed their CDN bill had skyrocketed. The dashboard showed everything was normal. We pulled the access logs and grouped by the refer_domain field. The top referrer wasn't their own domain – it was an unfamiliar website. Their images were being hotlinked, generating massive bandwidth theft. The dashboard's aggregate metrics never revealed the problem.
Aggregated dashboards are fine for health checks. But real troubleshooting and security analysis require raw logs.
01 What's in a CDN Access Log?
A CDN access log records every user request in complete detail. Each log entry typically includes over 20 critical fields :
Performance analysis fields:
request_time: Request response duration (ms) – reflects actual user experienceresponse_size: Bytes returnedhit_info: Cache hit status (HIT/MISS)server_ip: CDN server IP that responded
Traffic analysis fields:
client_ip: Real client IP addressuri: Request pathuri_param: Request parametersdomain: Accelerated domain namerefer_domain: Request source domain – critical for hotlink detection
Security analysis fields:
http_code: HTTP status codeuser_agent: User agent informationuuid: Unique request identifier – used to trace a single request across the full path
02 Performance Analysis: Finding the Slowness
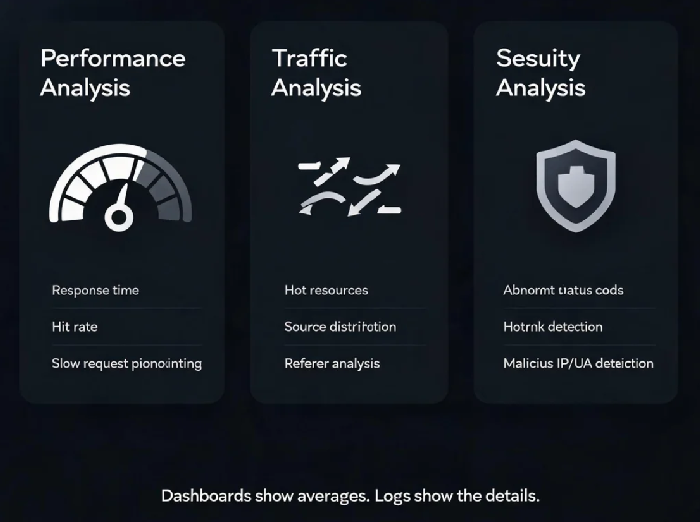
Core CDN performance metrics – byte hit rate, P95/P99 TTFB, edge vs origin errors – all must be calculated from raw request logs. Pre‑aggregated dashboards lose context and prevent root cause analysis.
Pinpointing slow requests: Sort by request_time to find the slowest requests. Combine with server_ip to check if the issue is confined to specific edge nodes. If slow requests cluster on certain nodes, the problem is likely network or origin‑fetch latency on those nodes.
Cache hit rate analysis: Count HIT vs MISS from the hit_info field. If hit rate is below 80%, group by URL to find the resources with the lowest hit rates – then adjust caching policies accordingly.
Byte hit rate vs request hit rate: These are different. If most requests are for small cached files but one large file misses cache, request hit rate may look high while byte hit rate is low. The latter directly impacts your bill .
03 Traffic Analysis: Who Is Accessing What
Identifying hot resources: Group by uri to find which resources generate the most requests and traffic. If a resource suddenly jumps to the top of the list, it may be hotlinked or part of a viral event.
Source analysis: Group by refer_domain to see where your traffic originates. An unfamiliar domain in the top referrers indicates your resources are being hotlinked.
Client distribution: Group by user_agent to understand which browsers and devices your users are on.
04 Security Analysis: Finding Attack Clues in Logs
Monitoring abnormal status codes: The http_code field is your first line of defence. Large volumes of 4xx or 5xx errors indicate something is wrong – investigate promptly .
Hotlink detection: If a referrer domain (refer_domain) is generating many requests but is not in your whitelist, your resources are being hotlinked.
Identifying IP‑based attacks: Group by client_ip to find the top requestors. A single IP generating an unusually high number of requests in a short time window may be a malicious scraper or a CC attack .
05 Choosing Your Analysis Tools
Real‑time logs: Cloud providers offer real‑time log delivery (Tencent Cloud CLS, Alibaba Cloud SLS, Huawei Cloud LTS) with latency under 3 minutes. They also provide out‑of‑the‑box dashboards: basic metrics, error analysis, popular resources, and user analysis .
Offline logs: For simple queries, awk, sed, and grep can do the job. For example, to get a status code distribution: awk '{print $status_code_position}' access.log | sort | uniq -c | sort -nr. For richer visualisations, use ELK or Splunk .
Recommendation: Use provider dashboards for daily monitoring. Download raw logs for deep dives when troubleshooting.
The Bottom Line
The value of CDN logs isn't in the logs themselves – it's in what you do after reading them. Spot a hotlinking referrer? Configure hotlink protection. Find low hit rate resources? Tune caching policies. Identify slow requests on specific nodes? Check the origin‑fetch path. Every log line is a potential optimisation opportunity.
Dashboards show averages. Logs show the details. When was the last time you looked at your CDN logs?